

Golf Course Orthomosaics
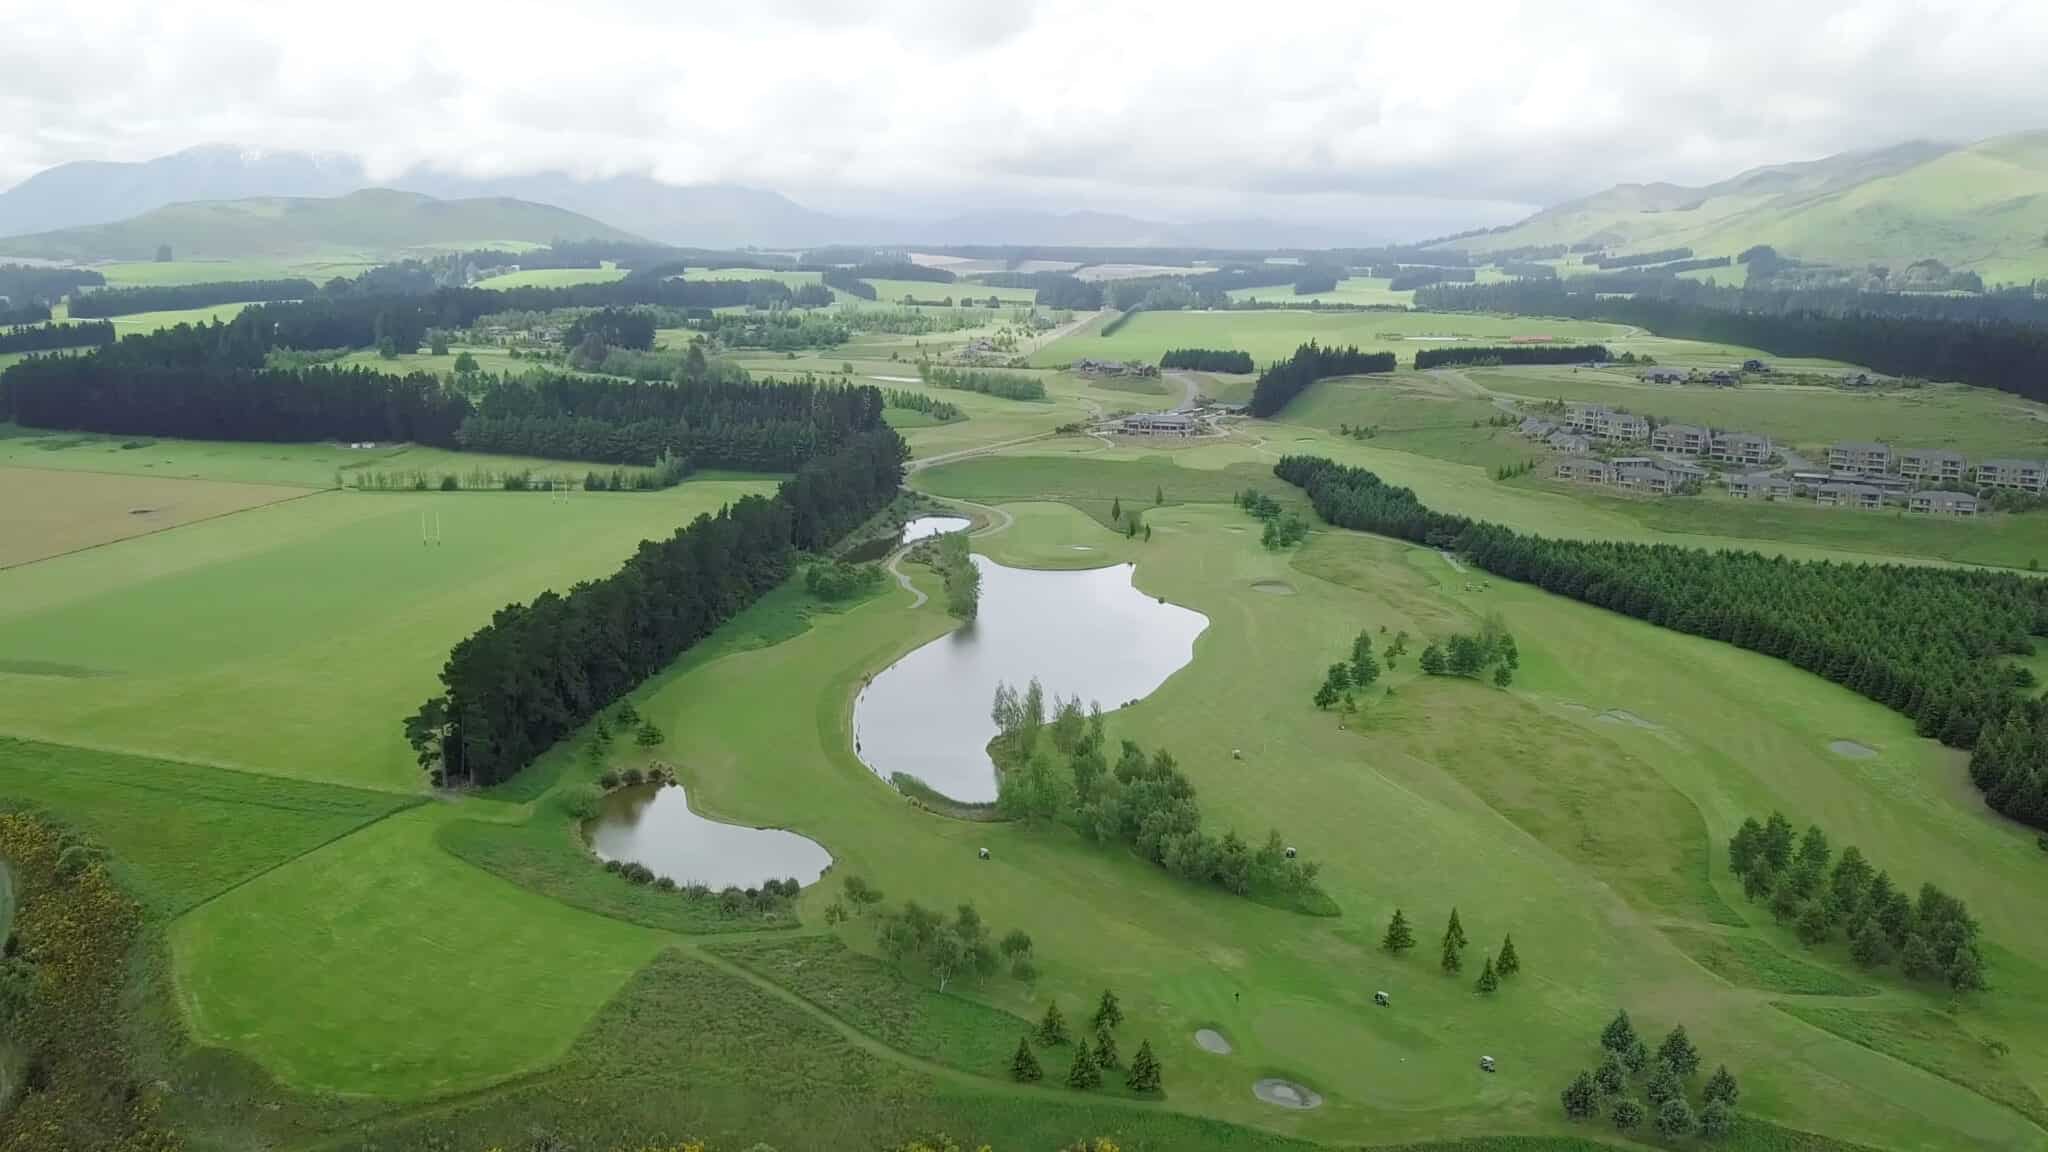
Enhance Golf Course Maintenance with Remote Sensing
Tex-Air Drone uses advanced Sentera 6X Thermal Pro multispectral imaging to help golf courses conserve water, improve turf health, and make better fertilizer decisions. By capturing high-resolution RGB, multispectral, and thermal data in a single drone flight, we create detailed orthomosaic maps that show stress patterns across greens, fairways, tee boxes, roughs, and high-traffic areas.
NDVI and NDRE vegetation indexes help identify weak turf, chlorophyll changes, irrigation stress, nutrient variability, and areas that may benefit from variable rate fertilizer applications. Thermal data adds another layer by showing canopy temperature differences that may indicate drought stress, irrigation coverage problems, or drainage issues.
Instead of relying only on visual inspections from the ground, golf course superintendents can use drone-based multispectral maps to target water, fertilizer, labor, and maintenance where they are needed most. This helps reduce waste, protect turf quality, document course conditions, and support smarter long-term agronomic decisions.
Tangible Reasons for a Golf Course to Use Multispectral Orthomosaics
Finding Irrigation Problems Before Turf Damage Is Visible
A superintendent may not see an irrigation issue until the turf is already declining. Multispectral and thermal data can flag problems earlier. Examples include:
- Plugged sprinkler nozzles
- Weak pressure at the end of an irrigation run
- Broken heads
- Poor overlap between sprinkler arcs
- Dry edges around bunkers, greens, and cart paths
- Wet spots caused by leaks or poor drainage
- Compaction zones where water is not infiltrating properly
Thermal imagery is especially useful because drought-stressed turf often runs warmer than well-watered turf. When thermal data is collected at the same time as multispectral and RGB imagery, the course gets both plant-health information and surface-temperature information from the same flight. Sentera notes that the 6X Thermal Pro integrates multispectral, RGB, and thermal imagery into a single sensor, allowing multiple data layers to be collected in one flight.
Building a Baseline Health Map of the Entire Course
One flight gives the golf course a baseline map of:
- Greens
- Collars
- Tee boxes
- Fairways
- Roughs
- Native areas
- Drainage corridors
- High-traffic areas
- Bunker surrounds
- Cart-path edges
That baseline becomes valuable when repeated every 2–4 weeks, monthly, or seasonally. The superintendent can compare maps over time and see whether a problem is expanding, improving, or staying stable.
This is where drone mapping becomes a management tool, not just an inspection tool.
Water Conservation Through Irrigation Stress Mapping
A multispectral and thermal flight can identify areas of the course that are showing signs of water stress, even when the turf still looks green from the ground. This matters because golf courses often overwater large areas to protect small stressed areas. A drone map allows the superintendent to separate:
| Area Type | What the Map May Show | Operational Decision |
| Dry stress zones | Low vigor, high canopy temperature | Check sprinkler coverage, heads, pressure, nozzles, soil moisture |
| Overwatered zones | Weak vigor, possible saturated areas | Reduce irrigation, inspect drainage |
| Healthy zones | Consistent NDVI/NDRE and normal canopy temperature | Maintain current watering schedule |
| Patterned stress | Circular, linear, or sprinkler-shaped anomalies | Diagnose irrigation system problems |
The biggest water-conservation benefit is that the course can stop treating the entire fairway, green surround, or rough as one uniform area. Instead, irrigation decisions can be made by zone, hole, fairway section, green complex, tee box, or problem area.
How NDVI Helps a Golf Course
What NDVI Shows
NDVI, or Normalized Difference Vegetation Index, compares red and near-infrared reflectance. In simple terms, it helps show how actively the turf canopy is growing and how much healthy vegetation is present For a golf course, NDVI can help identify:
- Thin turf
- Weak turf density
- Drought-stressed areas
- Traffic-stressed areas
- Poor recovery zones
- Disease-prone areas
- Areas affected by poor irrigation coverage
- Nutrient-deficient zones
- Areas where turf is declining before it is obvious visually
Practical Golf Course Example
A fairway may look fairly uniform from the cart path. But an NDVI orthomosaic may show that the middle-left side of the fairway is weaker than the rest of the hole. That could indicate:
- Sprinkler overlap issue
- Compacted soil from cart traffic
- Shallow soil
- Poor root development
- Nutrient deficiency
- Heat stress
- Disease pressure beginning to develop
Instead of fertilizing or watering the whole fairway harder, the superintendent can inspect the exact area and treat only the problem zone.
How NDRE Helps a Golf Course
What NDRE Shows
NDRE, or Normalized Difference Red Edge Index, uses the red-edge band and near-infrared band. NDRE is often more useful than NDVI when turf is dense, mature, or already very green. That matters on a golf course because greens, fairways, and tee boxes often have dense managed turf. NDVI can sometimes become saturated in dense vegetation, meaning it may not show subtle differences as clearly.
NDRE is better for detecting changes related to:
- Chlorophyll activity
- Nitrogen status
- Nutrient uptake
- Early stress in dense turf
- Subtle changes in plant vigor
Practical Golf Course Example
A green may look excellent visually, and NDVI may still look strong. But NDRE may show one section beginning to lose chlorophyll activity.
That could suggest:
- Early nitrogen deficiency
- Root-zone issue
- Water imbalance
- Heat stress
- Disease onset
- Compaction
- Poor recovery after play
NDRE gives the superintendent an earlier warning signal before the turf visibly declines.
How NDVI and NDRE Help With Variable Rate Application of Fertilizer
VRA Can Reduce Fertilizer Waste
Instead of applying one blanket rate across every fairway or rough, the course can use NDVI/NDRE maps to create variable rate application zones. For example:
- Healthy fairway areas may receive a reduced rate.
- Moderate areas may receive the normal rate.
- Weak areas may receive a higher rate if the issue is nutrient-related.
- Non-responsive areas may be flagged for soil testing instead of wasting fertilizer.
This can help reduce:
- Over-application
- Nutrient runoff
- Fertilizer cost
- Excessive growth flushes
- Mowing burden
- Environmental risk near ponds, creeks, and drainage ways
Fertilizer Decisions Become Measurable
The real benefit is not one flight. The benefit is comparison over time. A golf course can fly:
- Before fertilizer application
- After application
- During stress periods
- After irrigation adjustments
- During seasonal transition
Then the superintendent can see whether the turf actually responded. That gives the course measurable answers:
- Did this fertilizer program improve weak fairway areas?
- Did the green surrounds recover?
- Are we wasting fertilizer on areas that are not responding?
- Are low-vigor areas actually water-related instead of fertility-related?
- Is one hole consistently weaker than the others?
- Are shaded or compacted areas being misdiagnosed as nutrient problems?
Fertilizer Can Be Applied Where the Turf Actually Needs It
Multispectral maps can be used to divide the golf course into management zones:
| Zone | NDVI/NDRE Reading | Possible Action |
| High vigor | Strong NDVI/NDRE | Maintain or reduce fertilizer |
| Moderate vigor | Slight decline | Apply standard rate |
| Low vigor | Weak NDVI/NDRE | Investigate, then apply targeted fertilizer if nutrient-related |
| Abnormal stress | Low index + high thermal | Check water/soil first before applying fertilizer |
This is important: low NDVI or NDRE does not automatically mean “add fertilizer.” It means the turf is stressed or less vigorous. The superintendent still needs to determine whether the cause is fertility, irrigation, disease, compaction, shade, traffic, soil salinity, or drainage. That is where Tex-Air Drone’s value becomes stronger: the orthomosaic points the superintendent directly to the problem areas so they can ground-truth them.
How Multispectral Helps Understand Turf Stress
Multispectral imagery helps identify stress patterns that are hard to see from the ground because turf stress is not always uniform
Common Stress Issues That Can Be Mapped
Water Stress
NDVI/NDRE may show weak plant vigor, while thermal imagery may show elevated canopy temperature. That combination strongly suggests irrigation or moisture-related stress.
Nutrient Stress
NDRE can help detect chlorophyll-related changes that may indicate nitrogen or nutrient uptake issues.
Compaction
Compacted areas often appear as recurring stress zones. These may show up near cart paths, tee exits, fairway landing zones, maintenance routes, and high-traffic areas.
Drainage Problems
Wet areas, poor infiltration zones, and low-lying areas can show abnormal plant response. Some may look lush at first but decline later due to poor root oxygen.
Heat Stress
Thermal data can help show which turf areas are hotter and under more stress during peak summer conditions.
Shade Stress
Trees, structures, and topography can create recurring low-vigor zones. Multispectral maps help separate shade-related stress from irrigation or fertility issues.
Golf Course Benefits
GREENS
Detect subtle turf stress before visible decline
Compare greens, collars, and approaches
Identify water imbalance and irrigation coverage issues
Monitor recovery after aerification or treatment
Locate areas that need soil testing or targeted hand-watering
Fairways
Create irrigation and fertilizer management zones
Identify sprinkler coverage and pressure problems
Find weak turf caused by compaction, traffic, or uneven watering
Support variable-rate fertilizer applications
Track turf performance and treatment response throughout the season
TEE BOXES
Identify high-use wear patterns
Monitor recovery after tee rotation
Detect weak rooting, drought stress, or excess moisture
Prioritize overseeding, renovation, and maintenance areas
Document before-and-after improvements
ROUGH AND NATIVE TURF MANAGEMENT AREAS
Locate drought-stressed or overwatered areas
Reduce unnecessary irrigation and blanket watering
Monitor weak turf cover and invasive vegetation
Identify areas suitable for lower-input management
Improve water conservation without sacrificing course appearance
BUNKER SURROUNDS AND CART PATH EDGES
Detect heat, drought, and irrigation gaps
Identify cart and foot-traffic wear
Find compaction affecting turf health
Prioritize targeted watering and repairs
Prevent small issues from spreading
COURSEWIDE MANAGEMENT AND DOCUMENTATION
Detect turf problems earlier
Improve irrigation and fertilizer planning
Separate water stress from nutrient issues
Provide visual proof for decision-makers
Support repairs, programs, and budgets
GOLF COURSE DRONE SERVICES IN AMARILLO, TX
We provide golf course drone services using the Sentera 6X Thermal Pro to create measurable maps of turf health, water stress, and fertilizer efficiency across the entire course. Superintendents can quickly identify declining turf, inefficient irrigation, excess water use, and areas where fertilizer applications may need to be adjusted.
Serving Amarillo, TX and the Texas Panhandle.